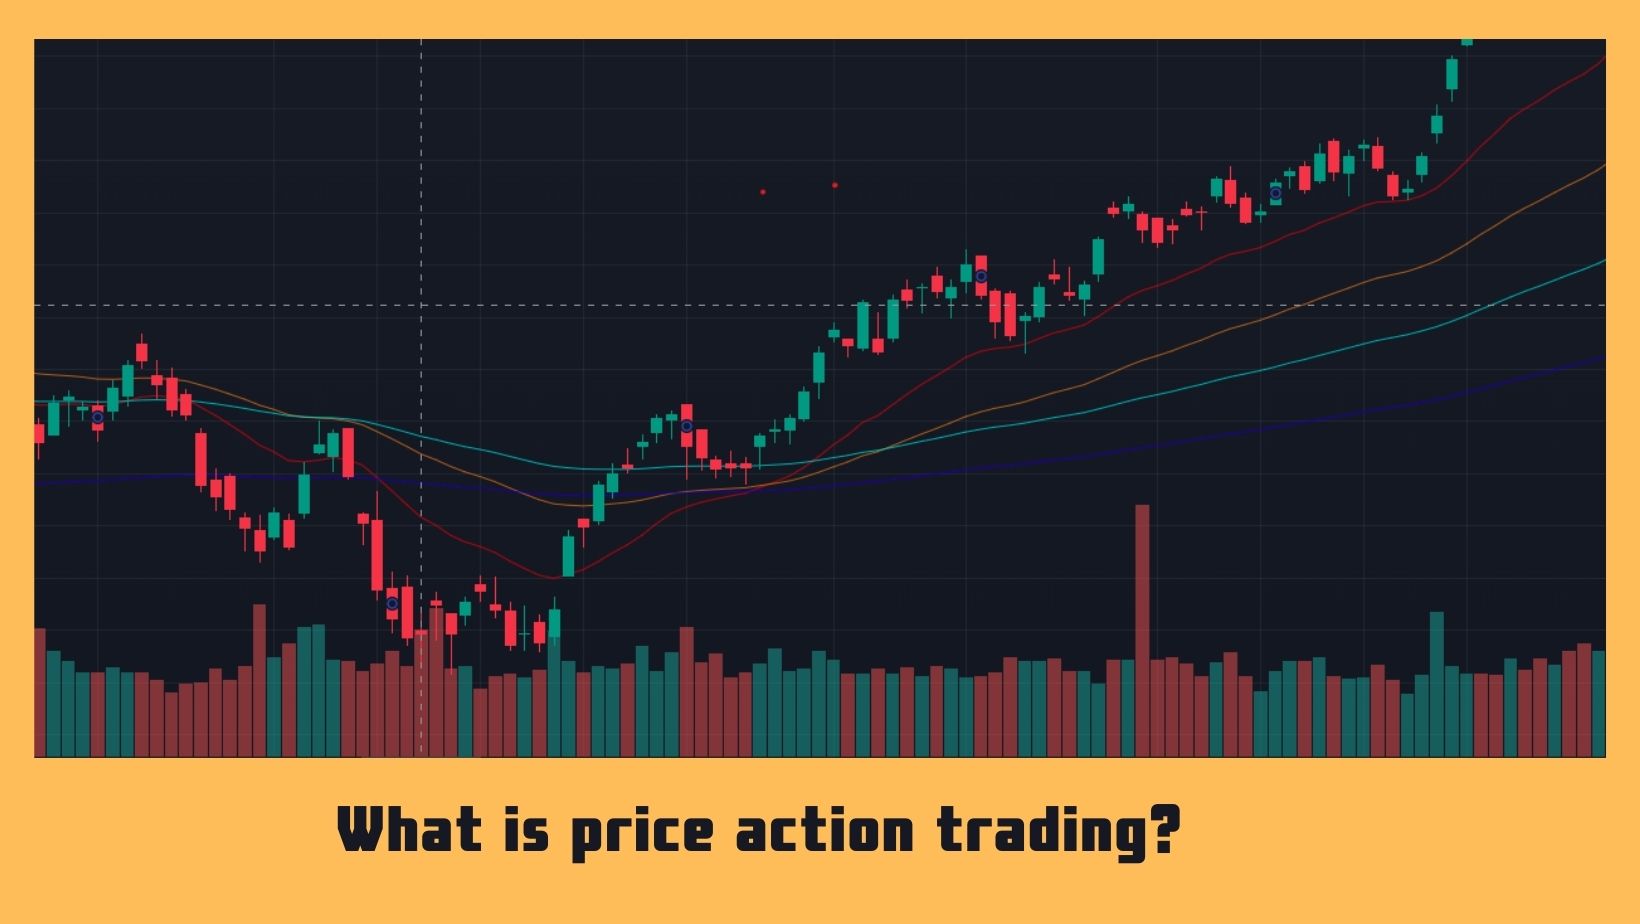
Wondering what is price-action trading? Markets are continuously shifting, whether they are in an upswing, a downtrend, or have low or high volatility. So, how do you keep track of what the market is doing? When can an investor predict entry and exit points with more accuracy? Indicators, fundamentals, algorithms, block chain approaches, price movement, and other methods are used to predict and speculate on the market. Let us look at several aspects of Price Action and Price Action trading in this article.
The term “price action” refers to the fluctuation of a security’s price over time. It serves as the foundation for any technical analysis of a stock, commodity, or other asset chart. Technical analysis is a subset of price action in that it uses prior prices in calculations to make informed trading decisions. Short-term traders make trading decisions only based on price activity, trends, and formations derived from it.
What is the role of price-action trading?
Price action serves as the cornerstone for technical analysis of equities, as well as assets and commodities. Price action on charts is used by technical analysts to investigate patterns or indicators that might help forecast how a stock will behave in the future, allowing them to synchronize the entry and exit points of trades correctly. Furthermore, many traders utilize this technique to identify critical price levels and trends, as well as to develop risk management strategies.
Understanding Price Action Trading
Price action trading occurs when the price action technique is utilized to make trading decisions for any security, such as stocks, bonds, currencies, commodities, and derivatives. It is a method for making price predictions, speculating, and determining entry and exit points. It is also called ‘clean chart trading,’ ‘naked trading,’ or ‘raw or natural trading’ because the price is derived from the price chart. Decisions in this trading technique are based only on the security’s prior performance, not on news or any other data.
What exactly is the distinction between Price Action, Technical Analysis, and Indicators?
Price action indicators are flashes of activity on a trading chart that indicate the emergence of a trend. Experienced traders can easily identify these price action indications and use them to make smart market bets in real time.
Technical analysis employs several calculations to forecast future price changes. Price action, on the other hand, is exclusively based on an asset’s price fluctuations within the trading window.
Technical analysis seeks order in an otherwise chaotic trading environment. Traders employ a price action method to make more intuitive trading decisions by finding and acting on price action indicators.
What are the different price action strategies?
Price action trading:
The price action trend trade is concerned with trend analysis. Traders employ a variety of trading approaches to identify and follow price action patterns. The head-and-shoulder trade reversal is a popular approach.
This technique is popular among inexperienced traders as a trading tool because it successfully leverages the experience of their peers by tracking obvious price action trends. A ‘buy’ position will likely profit the trader when the trend is moving upward, and a ‘ sell’ position will likely benefit the trader when the trend is moving downward.
Inside bar:
This is a two-bar approach in which the inner bar is smaller than the outer bar and falls between the low and high ranges of the mother bar (or outer bar). The smaller bar is frequently created during a period of market consolidation, but it can also signify a market turning point, acting as a red herring.
Head and shoulders reversal trade:
The head and shoulders trend pattern describes a market movement that resembles the silhouette of a head and shoulders. One of the most widely used price action trading methods. It is simpler for the trader to select an entry position (usually after the first shoulder) and a stop loss (often after the second shoulder) to profit from a temporary peak, indicated by the head.
Three-candle reversal pattern:
This pattern indicates a trend reversal. It is composed of three candles, which emerge in the following order: a bearish candle (red), a candle with a lower high and a higher low, and a bullish candle (green). The third candle must close above the second candle’s high and have a higher low.
Understanding the benefits and limitations of price-action trading
Price-action trading aids in decision-making. Using the price-action trading system, you can improve your trading decisions by using prior prices (open, high, low, and close).
Price action trading is also better suited for short- to medium-term earnings on trades than long-term investments.
Limitations of price-action trading:
- Is completely determined by historical prices; price action trading is based on the history of the securities, but it is only sometimes a trustworthy predictor of future results2.
- Misinterpretation is possible: Because each trader has their own interpretations, rules, and financial knowledge, no two traders will see the same price movement in the same way.
Price action is a technique for analysing a security’s performance by following its price changes. Experienced traders are more likely to gain from this strategy since they can recognize patterns at a glance by perceiving specific shapes or historical performance. However, price-action trading has its own set of constraints. As a result, traders can validate indications using new tools in conjunction with this technique.


